Candlestick Charts
Candlestick charts are a popular tool used in financial markets to represent price movements of assets such as stocks, commodities, currencies, and indices over a specific time period. Originating from Japanese rice trading in the 18th century, candlestick charts provide more information than traditional line charts by displaying the open, high, low, and close prices within a given timeframe. This rich information allows traders and investors to make more informed decisions based on price action and potential market sentiment.
Components of a Candlestick
Each candlestick consists of two main parts:
-
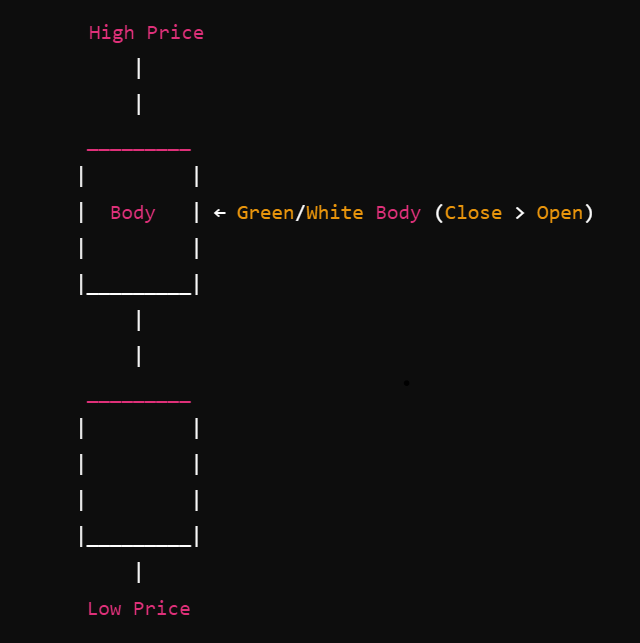
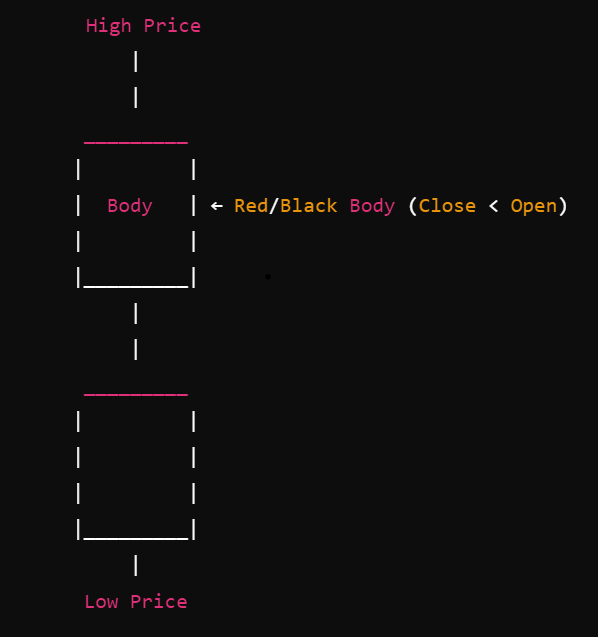
Body: Represents the range between the opening and closing prices.
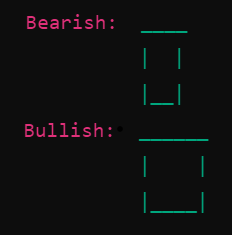
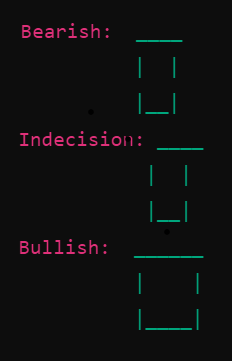
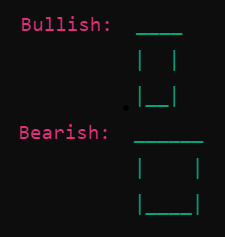
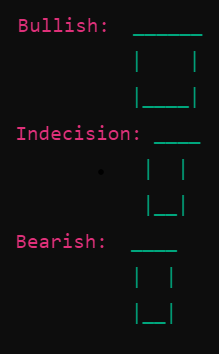
- Bullish Candle: Typically coloured green or white, indicating that the closing price is higher than the opening price.
- Bearish Candle: Typically coloured red or black, indicating that the closing price is lower than the opening price.
-
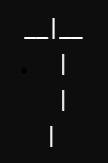
Wicks (Shadows): The thin lines above and below the body represent the highest and lowest prices during the time period.
- Upper Wick: Extends from the top of the body to the highest price.
- Lower Wick: Extends from the bottom of the body to the lowest price.
Basic Structure of a Bullish Candlestick
Basic Structure of a Bearish Candlestick
- Time Frame: Each candlestick represents a specific time frame (e.g., 1 minute, 5 minutes, 1 day).
- Price Action: The combination of the body and wicks provides insights into the market sentiment during the time frame.
- Long Body: Indicates strong buying or selling pressure.
- Short Body: Suggests indecision in the market.
- Long Wicks: Show that prices moved significantly during the time frame but were pulled back before the period ended.
Common Candlestick Patterns
Understanding candlestick patterns can help predict future price movements based on historical patterns. Below are some of the most common patterns categorized into bullish (indicating potential upward movement) and bearish (indicating potential downward movement) signals.
Bullish Patterns
-
Hammer
-
Bullish Engulfing
-
Morning Star
Bearish Patterns
-
Shooting Star
-
Bearish Engulfing
-
Evening Star
Neutral Patterns
-
Doji
-
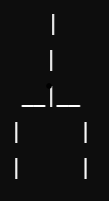
Spinning Top
Using Candlestick Patterns in Trading
Candlestick patterns are most effective when used in conjunction with other technical analysis tools such as trend lines, support and resistance levels, and indicators like Moving Averages or Relative Strength Index (RSI). Here are some tips for using candlestick patterns effectively:
- Confirm with Volume: Higher trading volume during the formation of a pattern can validate its strength.
- Context Matters: Patterns formed at key support or resistance levels tend to be more reliable.
- Combine with Trend Analysis: Identify the prevailing trend to determine whether a pattern suggests continuation or reversal.
- Use Multiple Time Frames: Analysing patterns across different time frames can provide a more comprehensive view of potential market movements.
Conclusion
Candlestick charts are a versatile and informative tool for analysing market behaviour. By understanding the basic structure of a candlestick—including the body and wicks—and the various candlestick patterns and their implications, traders can gain valuable insights into market dynamics such as bullish or bearish trends, reversals, and continuations. This comprehensive knowledge enables more informed trading decisions and the identification of potential price movements. However, while candlestick patterns can provide valuable signals, it is essential to use them in conjunction with other analysis methods and risk management strategies to enhance their effectiveness.

